Learning about the weather is an essential skill in preschool. Children should be able to tell the weather condition based on observations. Being able to differentiate these conditions provides awareness.
Children may be able to make decisions, such as the appropriate clothes to wear or activities to do, based on the weather.
We have listed ten fantastic weather charts to help children learn and understand the weather conditions.
Great Weather Crafts for Preschoolers
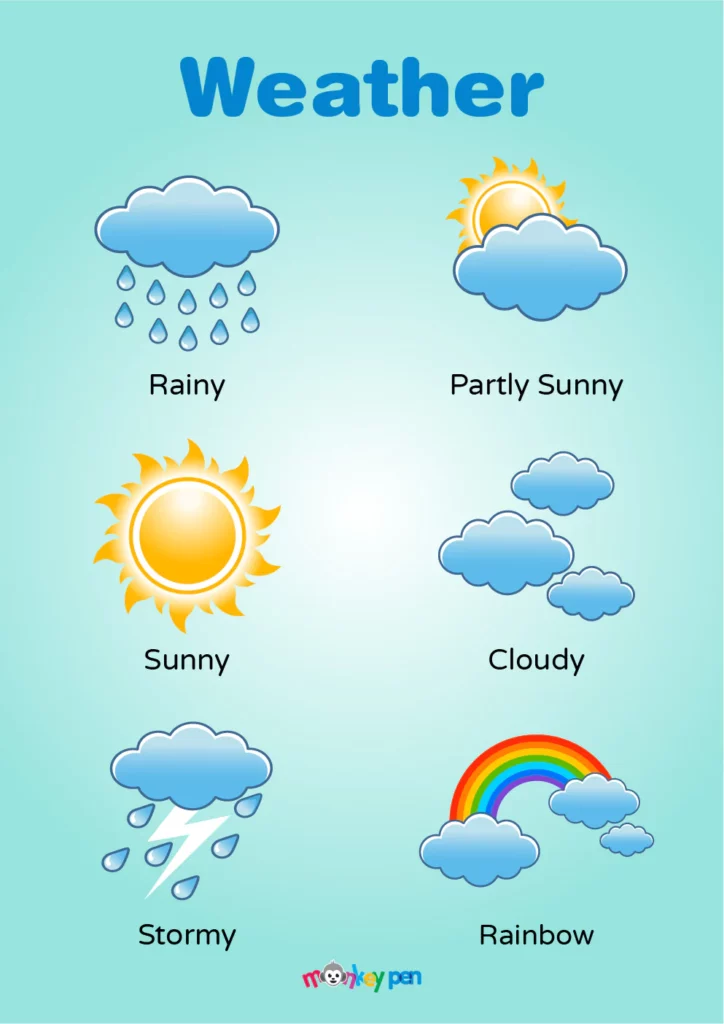
This free weather chart presents the basic weather conditions all at the same time. It is a great tool to introduce atmospheric science to young learners. The illustrations are presented in an easily understood format.
Use this chart to help children identify the weather type for the day. Point to specific details as a prompt, such as the sun hiding behind the clouds for the partly sunny condition or the presence of thunder and lightning for stormy weather.
This chart is perfect for placing on the wall where the child can see them at eye level and is a great resource to use during circle time. Give a pointer for children to use as they talk about the day’s weather.
Help children develop reasoning skills based on facts as discussions on weather-related topics are initiated. Talk about the type of activities that they can do during a sunny day or what they cannot do during a rainy day.
For more information on this chart, go to MonkeyPen.com.
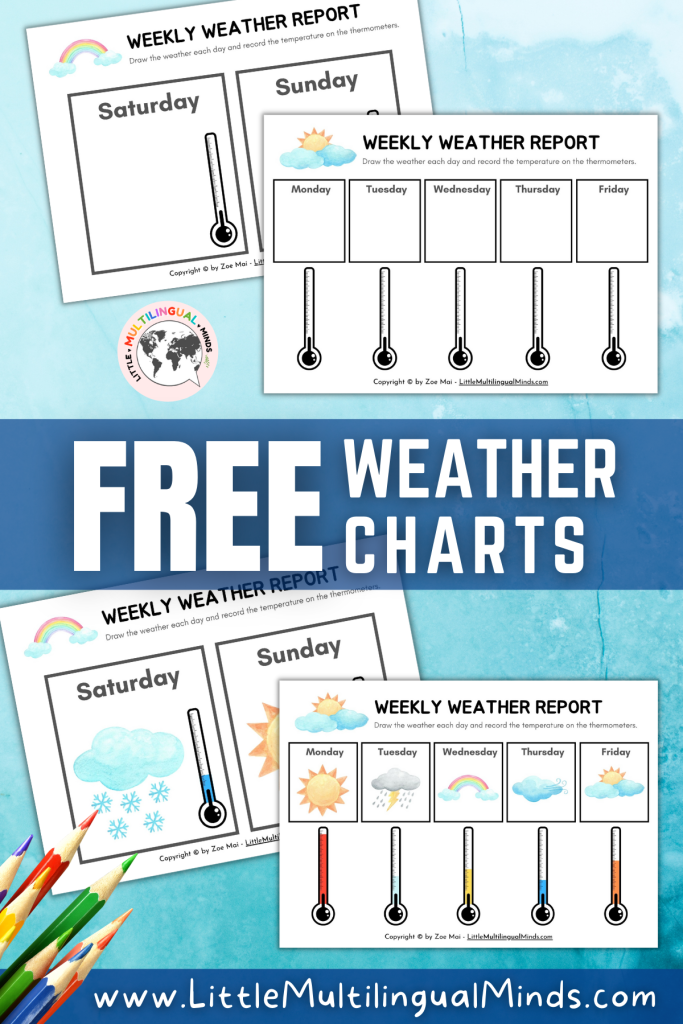
A weekly weather report sets this weather chart apart from the others. This chart is a great tool to teach children about planning. They can talk about the weather during the past day and the present.
Children will learn to track the weather and adjust their planned activities based on their findings. This chart can be used to introduce children to the concept of weather reporting.
The illustrations of the thermometers will help children understand that the heat and cold they feel on particular days can be measured. Point out that the more the thermometer is filled with color, the hotter it gets.
An extra chart asks the child about the current day, the weather conditions, and what they feel. This chart is a vital tool to help children understand the relationship between these factors. Here are some ideas that children should know.
First, the weather may change on a day-to-day basis. Second, the weather can be associated with the temperature, which tells how hot the weather condition is. Third, the temperature can be measured by a device called a thermometer.
For more information on this chart, go to LittleMultiLingualMinds.com.
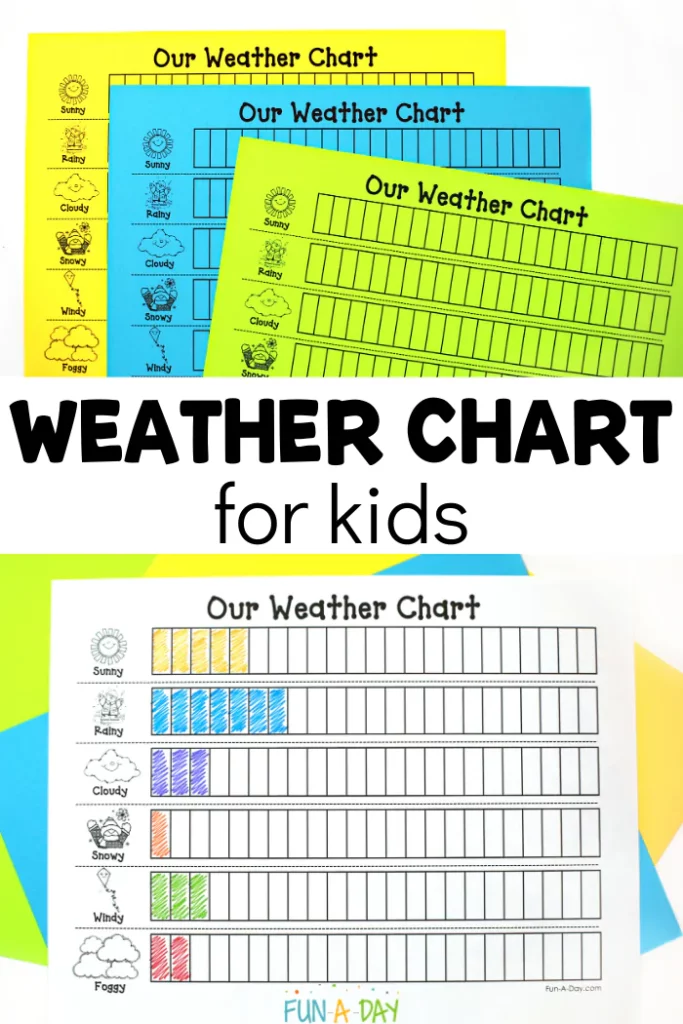
One of the most coveted jobs of children in preschool is the weather reporter. Like winning the grand prize in competitions, children take pride in being given the task of looking outside and telling everyone in a loud voice about the day’s weather conditions.
This unique weather chart is a great way to introduce the concept of graphs. Children will be able to learn how to track, count, sort, and compare the different weather conditions. This chart is a great way to organize information and make analyses every month.
Keep all the monthly charts and compare each month with the others. Use this as a math activity to practice more or fewer concepts, counting larger numbers, writing numbers, and simple addition and subtraction skills.
As the site recommends, use different colors to mark each weather condition. Have the children shade each box to represent a day. This step can be done from left to right to help them understand directionality.
Compile all these charts to make a weather book for children to enjoy. Place them in centers for children to use a piece of conversation or to discuss their observations as documented in each chart.
For more information on this chart, go to Fun-A-Day.com.
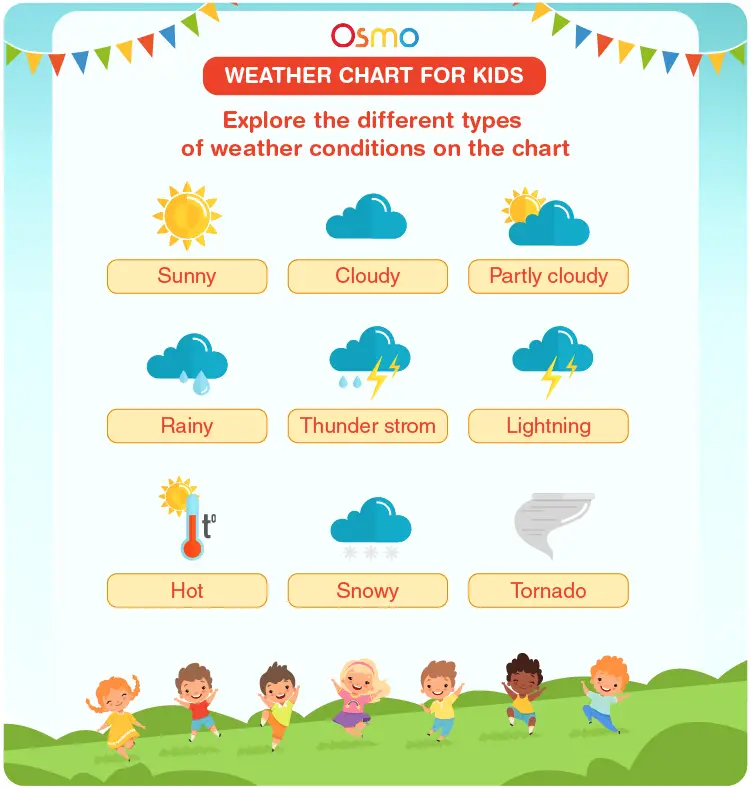
This weather chart is a set of three visual aids to use for children to learn about the weather conditions.
The first chart shows the different weather that children may observe. It has pictures of eight possible conditions ranging from sunny to a more devastating tornado.
The second chart is a weekly report of the weather. On the left part of the chart is a table with the days of the week. On its right are small circles with weather symbols, such as a snowflake for snowy days and clouds for cloudy days.
The third chart is used for children to identify the weather, find its symbol, and place it in the middle to remind everyone of the day’s condition. The last two charts are interactive resources that can be used to get children to engage.
The site provides additional ideas to make learning about the weather fun and exciting. Some of these include having a fashion show based on the weather conditions, watching weather forecast channels, and participating in games related to the weather.
For more information on this chart, go to PlayOsmo.com.
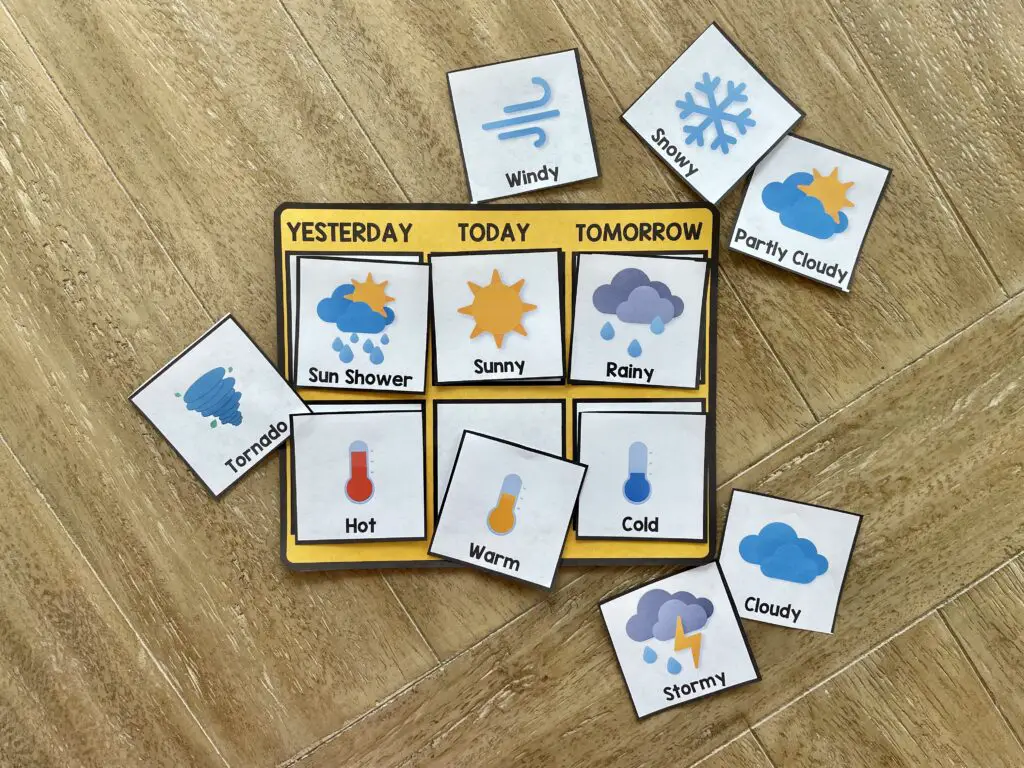
Here’s a concise and straightforward chart that can be printed for every child to use in class. There is no need for children to wait for their turn to become the day’s weather reporter with this handy chart.
This chart tracks the weather conditions in three days presented in the form of yesterday, today, and tomorrow. This part is placed on the top row, while the bottom row is for the temperature.
Children will learn to understand the relationship between weather conditions and temperature as they match these cards on the chart. The temperature illustrations provide clues using colors and the amount to indicate heat flow.
This resource is an excellent tool for children who are starting to learn about the weather and do not have the patience to track it every week.
The site recommends printing three sets for possible identical weather conditions in three days. It is also recommended to laminate these cards for durability.
For more information on this chart, go to TeachingLittles.com.
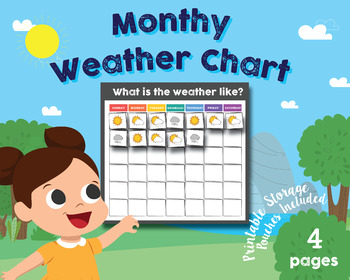
This monthly weather chart is an excellent way for children to track the weather for longer. This set comes in four printable pages, including a calendar-like page that includes all days of the week for the whole month.
It has small pictures or symbols of the weather conditions that will mark each day.
There are no words on these cards to name the type of weather, but most of them are self-explanatory. However, some symbols may look relatively similar to others.
Use this chart to learn about the weather, record information, and organize it. Show clips of weather reports from the weather channel and let them understand the importance of such programs.
Children will understand that being aware is a big step to being prepared for extreme weather conditions, such as when storms or tornados are present, which can be devastating.
Discuss the different reasons for these weather conditions and how the weather in some areas of the country differs due to location.
For more information on this chart, go to TeachersPayTeachers.com.
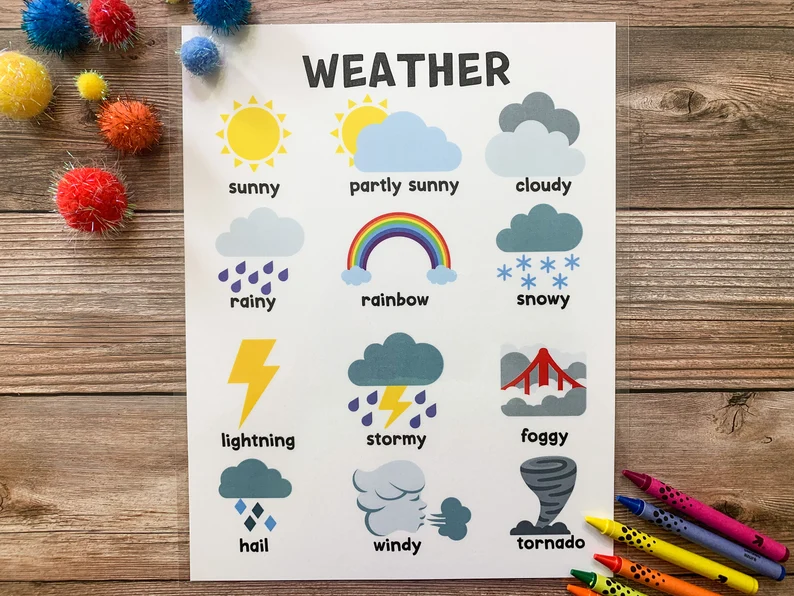
Colorful and easily understood illustrations are the main features of this chart. This weather chart comes with twelve conditions that can help teach young learners.
Included in this chart are the symbols for fog and hail, which are not usually found in other weather charts. This is a single chart that can be used repeatedly. Have children use pointers to tell the class about the day’s weather.
A sticker can be used as an indicator of the current weather. This chart does not allow children to track the weather for several days.
If the intention is to keep track of the conditions for a week, encourage children to make a simple journal in their notebooks or make one on the board for everyone to see.
Use this chart to discuss the weather changes and how seasons affect these conditions. Talk about the clothes and activities to match the weather conditions. Let children role-play based on the day’s weather.
For more information on this chart, go to Etsy.com.
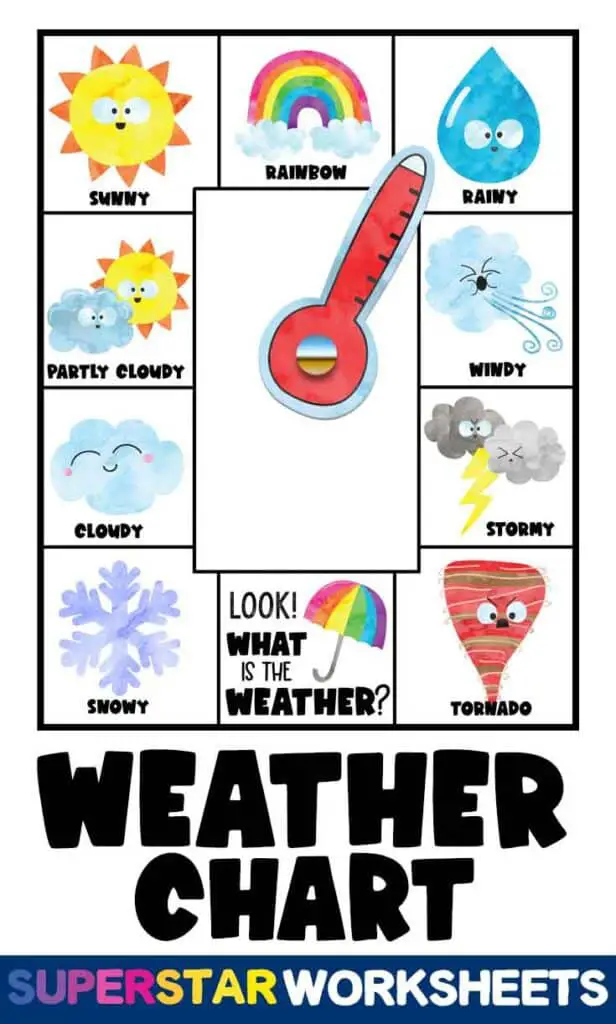
A customizable weather chart is heaven-sent for every preschool educator. And to make things better, it is free to download! Head to the site to download, print, and customize the chart to suit your student’s needs and interests.
There are two ways to use this chart to teach children about the weather; both interactively.
First, use the thermometer as a pointer. Cut out the thermometer and punch a hole in the middle of the round part. Punch another hole in the middle of the chart.
Attach a brad or a metal fastener with prongs on the thermometer and place it on the chart. Pull apart the prongs to secure them. Use this moving thermometer to point at the day’s weather.
The second way is to cut the middle part of the chart. Attach a large craft stick at the bottom. Use this as a viewer to see and observe the day’s weather. Finally, mark the observed weather by placing a clothespin on the corresponding picture.
For more information on this chart, go to SuperstarWorksheets.com.
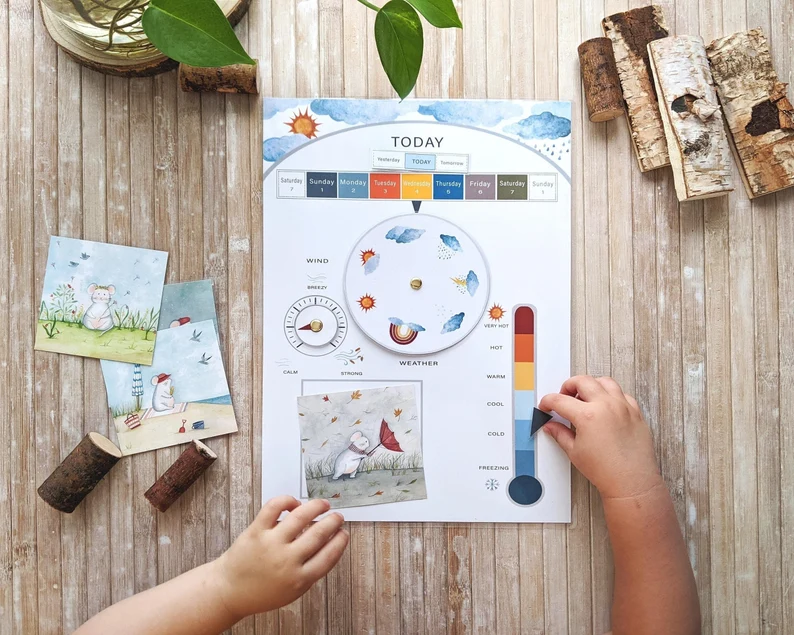
This weather chart is perfect for older children who can process more information about the weather. The chart comes with two time indicator-the days of the week and the “yesterday, today, and tomorrow” signs.
Under the days is a wheel of weather conditions that can be turned to where the arrow points. There are seven conditions to choose from.
Beside the wheel is the wind indicator in the form of a smaller wheel. Children can move the pointer to tell the quality of the wind. There are three types to choose from. These are calm, breezy, and strong.
On the left of the chart is an image of a thermometer with six descriptions of the heat level. These are freezing, cold, cool, warm, hot, and very hot. An arrow can be placed to indicate the day’s heat level.
Lastly, a square can be seen opposite the thermometer. This part is where the pictures depict what children will expect in such weather conditions.
Four beautifully illustrated weather conditions can be used. A mouse is the main character in these illustrations that can be used as a reference for children to talk about what to expect in specific types of weather.
For more information on this chart, go to Etsy.com.
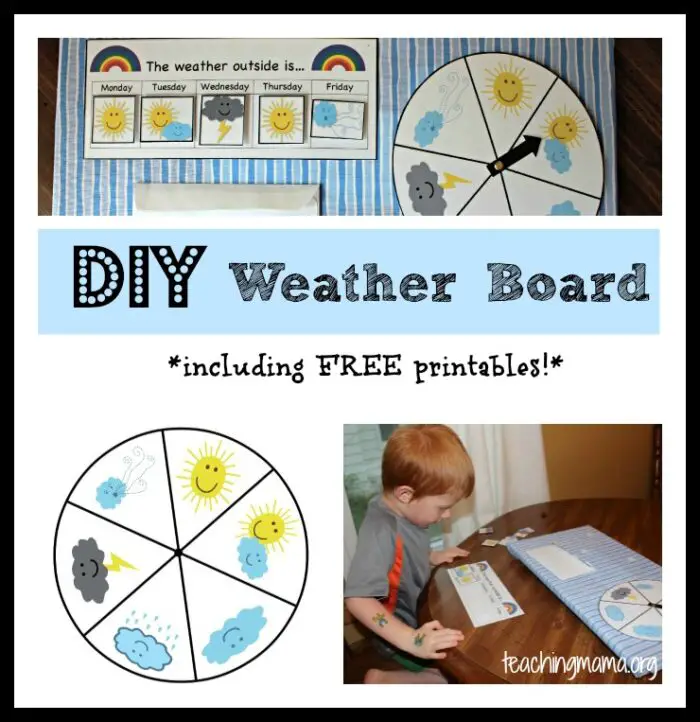
This chart is perfect for younger children learning about the weather and is free to download from the site. This resource is excellent to use in centers and during circle time.
Organize them in one board to display the chart and wheel and to hold the pieces for the chart. The site recommends using cardboard wrapped in fabric to make it visually appealing and easy to use.
Place an envelope to hold the small pieces for easy storage.
This weather chart has five days, from Monday to Friday, perfect for school days. Children will learn to track the weather conditions on days they are in school.
An interactive weather wheel is also included in this set. A hole can be punched in the middle of the wheel, and use a brad to attach the arrow. Let children use the arrow to point at the corresponding weather of the day.
The site recommends laminating the pieces to make them sturdy for repeated use.
For more information on this chart, go to TeachingMama.org.
Conclusion
Teaching the concept of weather is not complicated by using these beautiful charts. Children will appreciate the colorful and interactive ways they are presented.
The charts are versatile and can be modified to accommodate the different needs of children. Some have manipulatives, while others have pictures to point at. Some teach tracking the weather for a week while others for a more extended period.
We hope you like our list. Thank you for reading!
People Also Ask
Children should understand that there is a science behind the weather events that happen daily. Help children understand that these events are caused by many things and these happen naturally.
Use resources to help children understand these concepts such as books, charts, and videos. Demonstrate how to tell the kind of weather a day has by pointing out obvious signs such as the sun is out for a sunny day, or the wind is blowing hard on windy days.
See more charts and worksheets for preschoolers:


